Various Demographic Factors Effect on Students’ Participation In Extracurricular Activities
Data Collected from STA304H5F in 2024
Abstract
It is known that for students to have a well-rounded university experience, participation in extracurricular activities is vital, not only for academic but personal growth. However, student participation in extracurricular activities depends on a number of factors. Some include scheduling and time-commitment factors, commute factors, and the diversity of student activities and clubs. This study aims to explore this by investigating the reasons that students select certain extracurricular activities at the University of Toronto Mississauga (UTM) campus. An anonymous online survey on Google Forms was created for students in a third-year statistics course to complete. Findings showed that there was no significant relationship between living distance from campus and program of study with extracurricular involvement. Findings did show that there was statistical significance between student status and activity preference (p = 0.013). The findings also showed there was a statistically significant monotonically increasing relationship (\(\rho\) = 0.937) between time commitment and activity count. As students increase their time commitment, so does their participation in extracurricular activities (ECAs). Although results produced minimal significant findings, we believe that this is a valiant step in the right direction towards investigating student participation at UTM.
1 Introduction
An important part of having a healthy life in university is maintaining a balance between school, work, and social life. Among other aspects, a major part of many university students’ social lives is extracurricular activities (ECAs). Being such a major part of students’ social lives, determining what factors can negatively impact student participation in ECAs is a critical step in helping minimize negative impacts on students’ well-being. This study focused on students in the Fall 2024 sections of STA304 at UTM and examined their levels of participation in various types of ECAs. In particular, we analyzed if various demographic factors affected students’ participation in ECAs. As UTM is primarily a commuter campus, of special interest was students living distance from campus. To conduct the study, during the first three weeks of October 2024 we distributed a survey on the STA304 Piazza Discussion board to collect data on student demographics factors and information relating to individual participation in ECAs. Our study consisted of three research questions.
1.1 Research Questions and Hypotheses
- Research Question 1: What is the most preferred type of extracurricular activity, and do demographic factors influence student preferences for certain extracurricular activities?
- \(H_{0}\): Student demographic factors have no effect on participation in extracurricular activities.
- \(H_{a}\): Participation in extracurricular activities is affected by demographic factors.
- Research Question 2: Does proximity to campus affect participation in extracurricular activities?
- \(H_{0}\): Proximity to campus has no effect on participation in extracurricular activities.
- \(H_{a}\): Students living further from campus will have lower participation rates.
- Research Question 3: Does timing/scheduling of extracurricular activities impact student participation in extracurricular activities?
- \(H_{0}\): Timing/scheduling of extracurricular activities has no impact on student participation.
- \(H_{a}\): Participation in extracurricular activities is affected by their timing/scheduling.
2 Data
2.1 Methodology
Data collection began in the first three weeks of October 2024 where an online anonymous survey on Google Forms was created for participants to complete. This survey was created in order to investigate the reasons that students select and participate in certain ECAs. This online survey was posted to a Piazza thread where students can easily locate the survey link. Although Stratified Random Sampling (StRS) with lecture sections (LEC0101 and LEC0102) as the strata was proposed, the study was carried out using Simple Random Sampling (SRS). StRS was not used due to the homogeneity of the lecture sections which negates any tangible benefits that StRS would have provided over SRS. Nevertheless, randomness was ensured as the link to the survey was posted to Piazza where everyone had the equal opportunity to complete the survey and be chosen for the study. We collected a sample of \(n = 63\) students. The survey consisted of 10 questions asking for details on their lecture section, demographic information, program of study, and distance from the UTM campus. We also included questions on the number, types, and the time commitment of the ECAs they are involved in. To encourage students to complete our online survey, we asked participants to share a link to their group’s survey, which we would complete in return.
We computed our sample size from a population of \(N = 200\), we chose a bound on the error of \(B = 0.1047\) and calculated with an approximation of the sample proportion being \(p = 0.5\). Calculating a sample size using \(n = \frac{Npq}{(N-1)\frac{B^2}{4}+pq}\) gives \(\frac{200*0.25*0.25}{(200-1)*\frac{0.1047^2}{4}+0.25} = 62.8643 \approx 63\)
3 Analysis
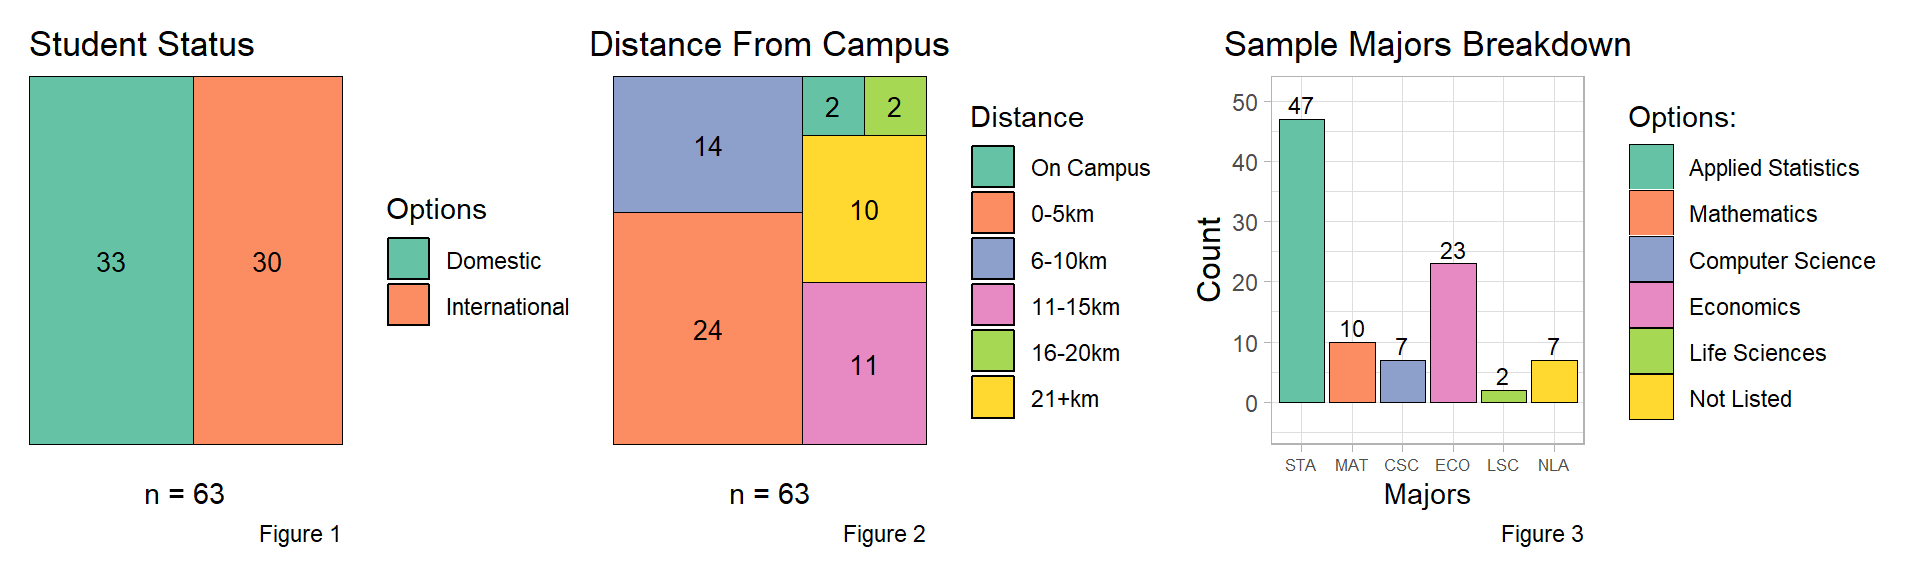
The analysis for our research questions is dependent on student responses to the various demographic questions asked in the survey. While each of the research questions will provide the results of the relevant demographic questions in depth, it is still beneficial to provide a cursory overview of the demographic results to provide context for the study as a whole. Our survey received 64 responses, with one duplicate being discarded, to give a sample size of \(n = 63\). Of that sample, results indicated higher percentage of males vs females, approximately a 6:4 ratio. Student status, distance from campus, and major breakdown are presented below visually, followed by brief summaries of the corresponding graphs.
Figure 1: The sample indicated an almost even split between International and Domestic Students
Figure 2: Students reported the distance they lived from campus in intervals of 5km
Figure 3: Students reported up to two majors, with the sample showing a large share of STA
3.1 Research Question 1
In this question we aimed to explore and find out which is the most preferred types of extracurricular activities whilst also examining whether demographic factors such as major, demographics and student status influence the preference for certain extracurricular activities. By conducting this analysis we hope to gain an understanding of the sample and the wider population in their extracurricular selection habits.
NOTE: For easy analysis and ability to come up with clearer conclusions, the Major column and the activity column were split into different rows.
For the most preferred type of extracurricular activity, we were able to get the count of students in the different extracurricular activities and display a graph showing the counts of students in each extracurricular activity.
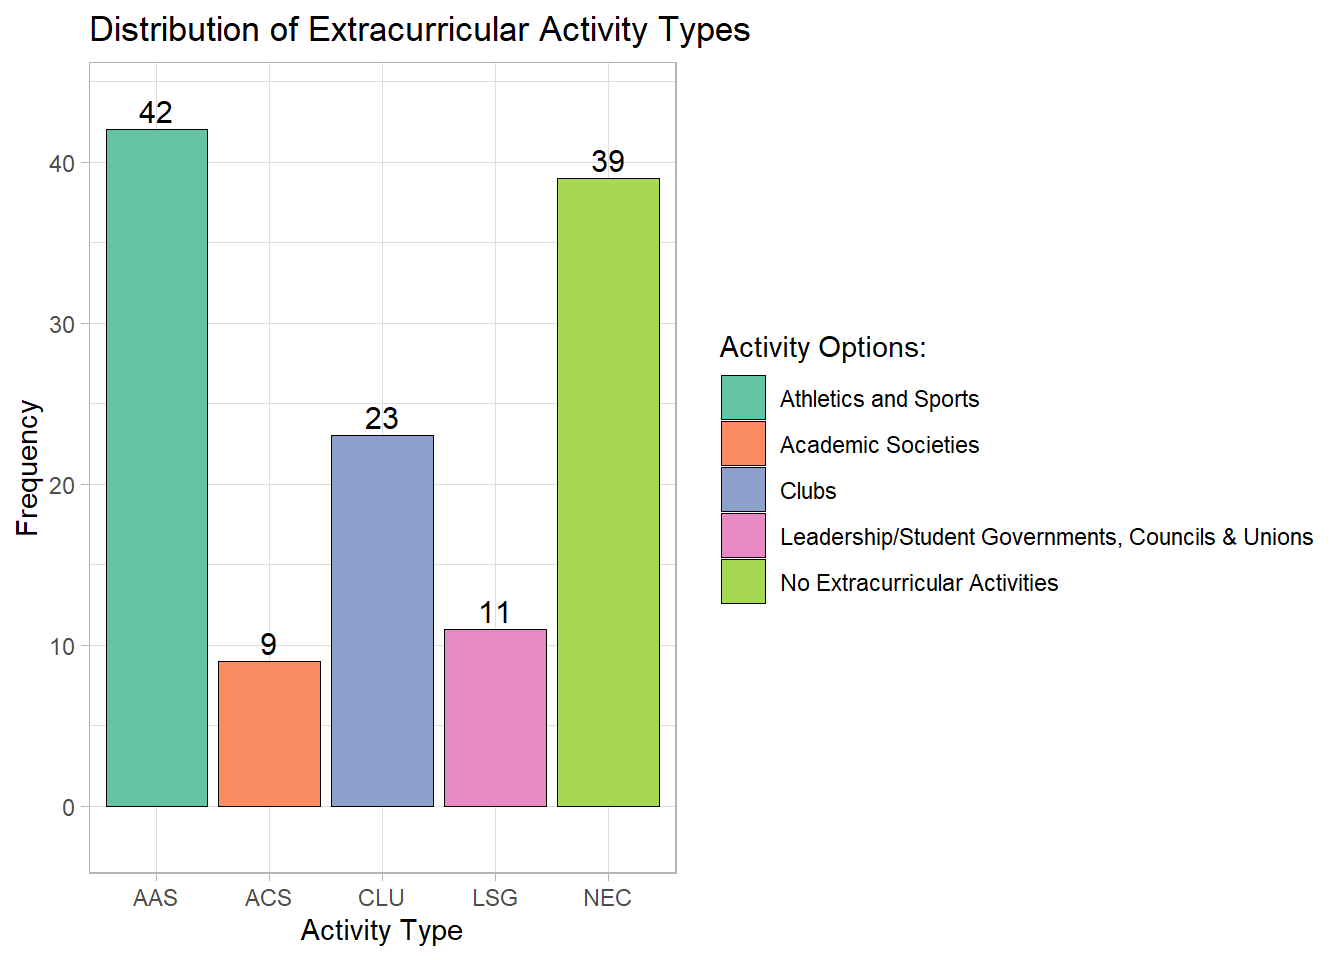
According to the bar plot, the most popular extracurricular activity among students was Athletics and Sports (AAS) with 42 students and the least popular extracurricular activity is Academic Societies (ACS) with 9 students. It was also particularly interesting to observe that most students do not participate in Extracurricular Activities, making the NEC category second in popularity.
To investigate the proportion of students participating in each activity by demographic factors like Major, Student Status and Gender Identity, we used three statistical tests, namely ANOVA, Welch-t-Test and the Wilcoxon rank-sum Test.
Before we began with our tests we first conducted preliminary assumption tests.
3.1.1 Testing for the Significance of Majors on Activity Preference using the ANOVA Test
To test for Normality we used a Q-Q residuals plot.
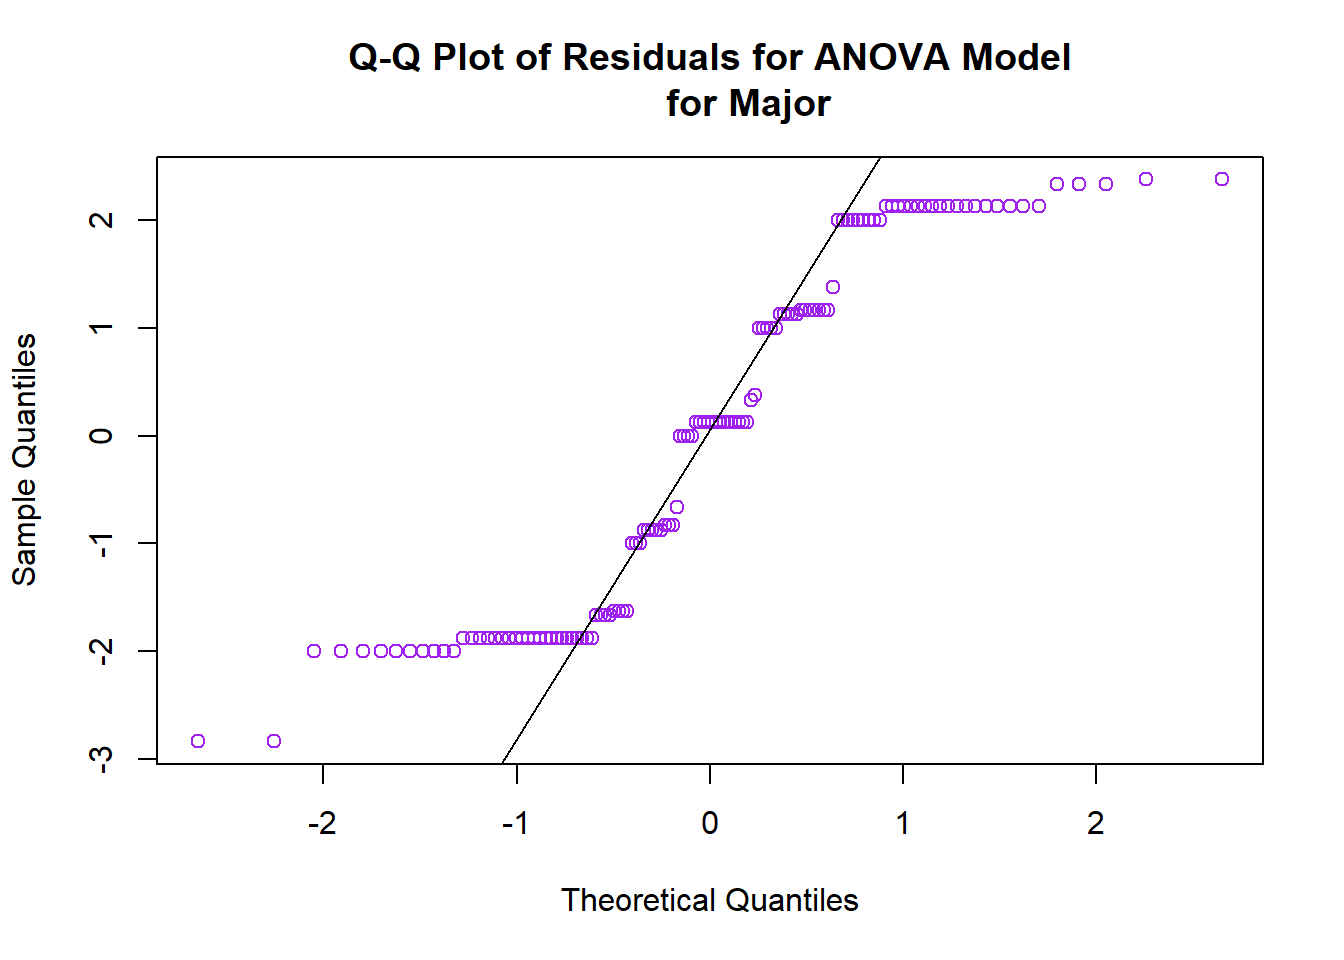
From the plot we can observe that the residuals are not normally distributed as they do not follow the straight line.
To test the equality of variances within each group we used the Levene Test.
| Df | F value | Pr(>F) | |
|---|---|---|---|
| group | 5 | 0.33924778365995 | 0.88821348003483 |
| 118 |
For the Levene test, we found that our F-statistic was 0.8882 and a p-value of 0.5433. Since the p-value is greater than the significance level of 0.05 we fail to reject the null hypothesis. This suggests that the variances in Activity Preferences across the groups are not significantly different. Therefore our assumption of homogeneity of variances is satisfied. As much as the normality was violated we still opted to use the ANOVA test since it passed the Levene Test confirming the homogeneity of variances and the sample size is large enough.
We then conducted the ANOVA Test to determine whether there are any significant differences in the mean proportions of student activity preferences and their respective majors.
| DF | Sum of Squares | Mean Squares | F-Value | Pr(>F) | |
|---|---|---|---|---|---|
| major | 5 | 11.3293 | 2.26586 | 0.804024073303128 | 0.54898078588717 |
| Residuals | 118 | 332.5417 | 2.81815 |
After the ANOVA Analysis we can found the F-statistic was 0.8040 and a p-value of 0.5490. Since our p-value is greater than \(\alpha = 0.05\) we concluded that the differences in mean activity preferences across majors are not statistically significant.
3.1.2 Testing for the Significance of Gender on Activity Preference using the T-Test
Before we began the analysis, we conducted preliminary tests to ensure that we are fit to use this test.
| Gender | W Statistic | p-value |
|---|---|---|
| Males | 0.8573073 | 3.42e-05 |
| Females | 0.7645068 | 0.00e+00 |
We conducted the Shapiro-Wilk Test to determine if the distribution in both groups is normal. We were able to determine that both groups were not normal as both their p-values are below the significance level of 0.05. Showing that the normality is not satisfied for both groups.
To test the second Assumption of equality of variances we used the Levene Test.
| DF | F-Value | Pr(>F) | |
|---|---|---|---|
| group | 1 | 6.19201670921327 | 0.0141815438250056 |
| 122 |
With an F-statistic of 6.192 which is quite high indicating that there is a big difference between the two groups, we got a p-value of 0.0142 which is less than 0.05 suggesting that the variances in activity preferences between males and females are significantly different.
Since our variances aren’t equal and the normality assumption has also been violated we will conduct our significance test using the Welch t-Test.
| T Statistic | DF | p-value | Female Mean (\(\mu_F\)) | Male Mean (\(\mu_M\)) | |
|---|---|---|---|---|---|
| t | 0.8614468 | 111.3324 | 0.3908436 | 3.125 | 2.868421 |
With a T-statistic of 0.8614, degrees of freedom of 111.33 and a p-value of 0.3908, we failed to reject the null hypothesis since p-value is greater the significance level of 0.05. This therefore indicates that there is no significant difference in the mean activity preferences between females (\(\mu_{F} = 3.125\)) and males (\(\mu_{M} = 2.8684\)). Hence concluding that Gender doesn’t influence peoples extracurricular choices.
3.1.3 Testing for the Significance of Student Status on Activity Preference using the T-Test
We conducted preliminary tests before using the test and our results are as shown below.
| Student Status | W Statistic | p-Value |
|---|---|---|
| D | 0.8061721 | 0e+00 |
| I | 0.7818220 | 1e-07 |
| DF | F-Value | Pr(>F) | |
|---|---|---|---|
| group | 1 | 0.0108893630670963 | 0.917061284237081 |
| 122 |
From our results of the Shapiro-Wilk test we can concluded that our results are not normal.This is because we can see that the p-value of domestic students(0e+00) and international students(1e-07) are both less than \(\alpha\) = 0.05 allowing us to reject the null hypothesis.
For the Levene Test, an F-value of 0.0109 and a p-value of 0.9171 we were able to conclude that we should fail to reject the null hypothesis meaning that there is no difference in variances of activity preferences between the student status groups.
Since it failed the normality test, we opted to use the Wilcoxon test.
| W Statistic | P-Value | |
|---|---|---|
| W | 1428.5 | 0.01303 |
From the Wilcoxon Test of comparing the activity preferences between domestic and international students, with a W-statistic of 1428.5 and a p value of 0.01303 which is below the significance level of 0.05. This shows that there is a significant difference in activity preferences between domestic and international students.
3.1.4 Conclusion on Research Question 1
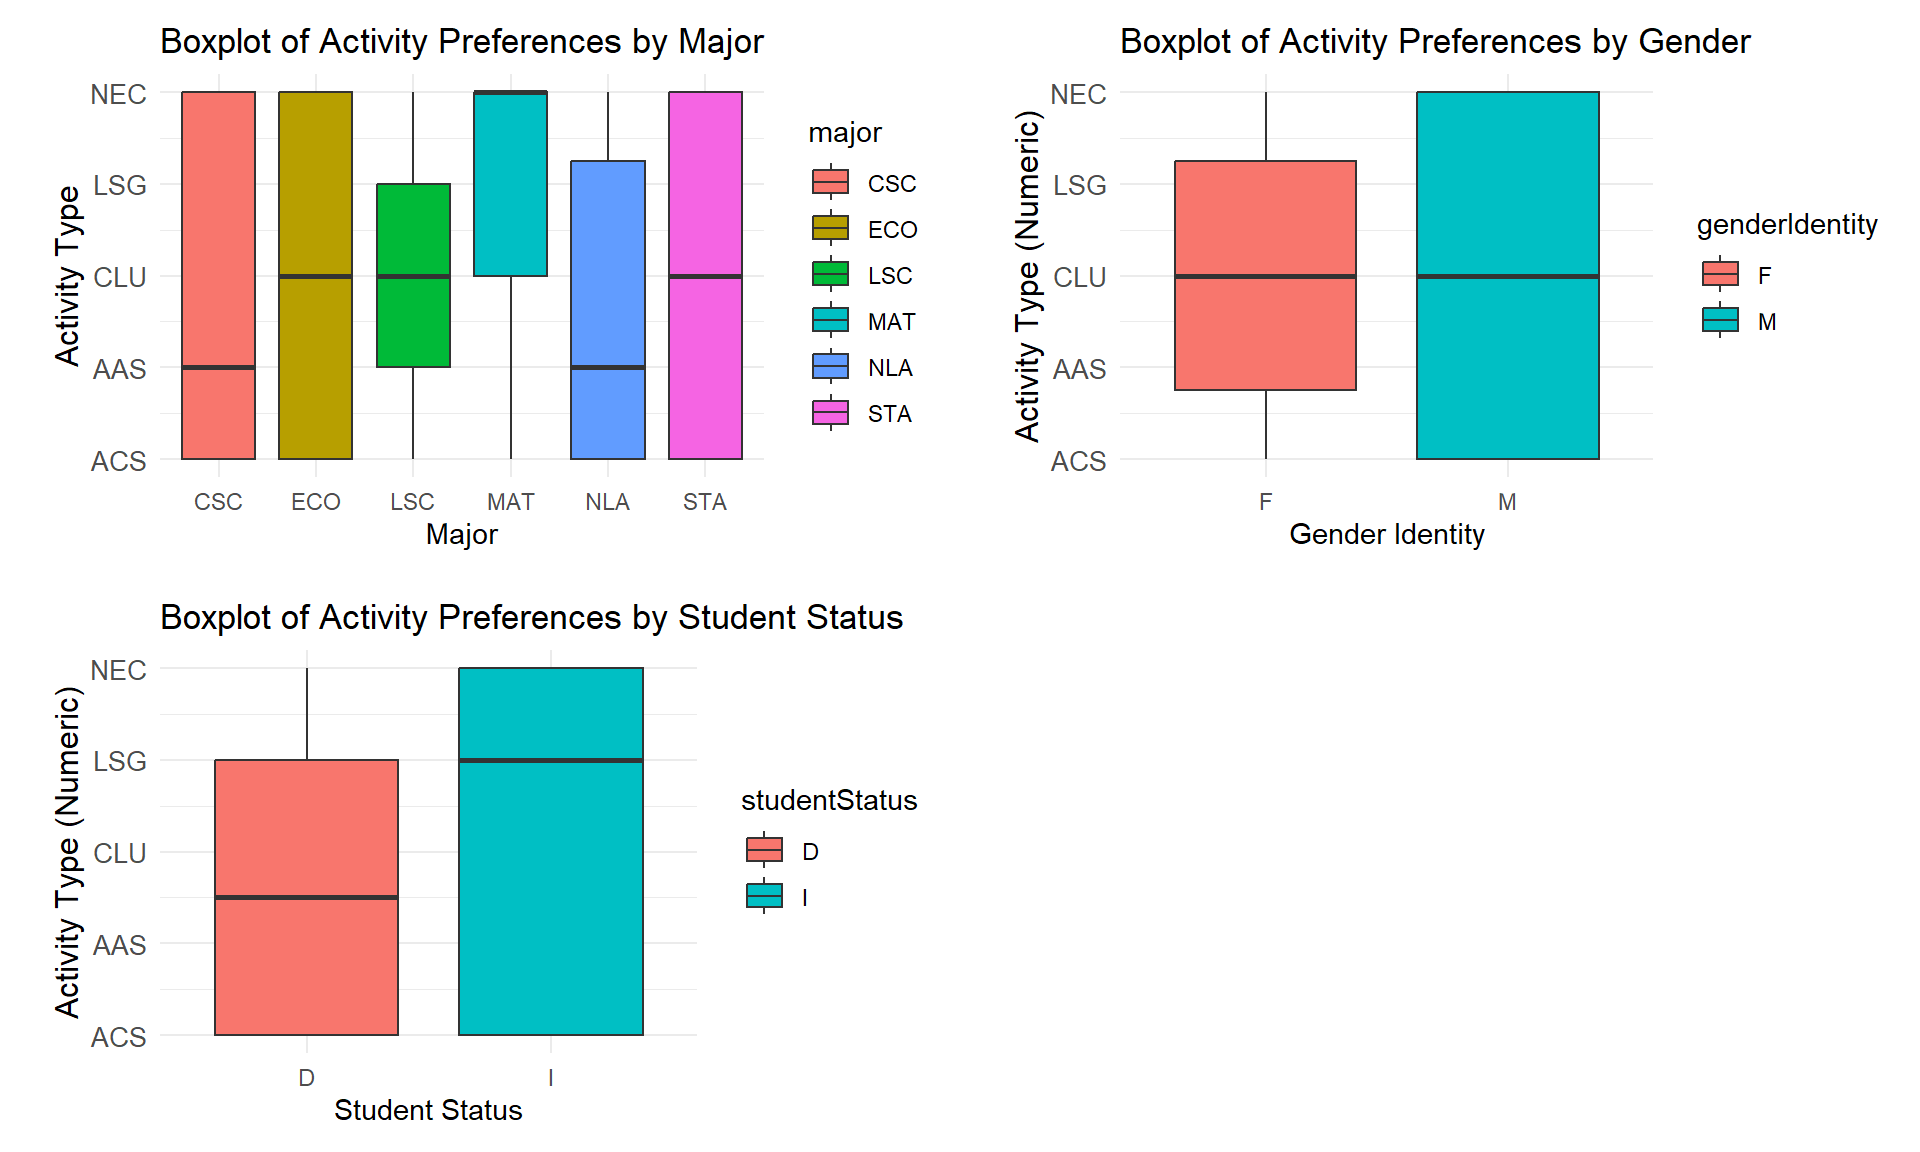
The box plots below will help in validating and visualizing the results that we got above.
For the first box plot, it is a representation of the activity preferences across the different majors. The overlap of the boxes heavily suggests that there is no significant difference in activity Preferences between majors
In the middle box plot, we can see the overlapping of the box plots, they also have almost similar medians further showing that there is no significant difference in activity preference between the two genders.
On the last box plot, we can see that the medians between the two are different which validates the result that we got from the Wilcoxon result. Even though the box plots are overlapping, there is more spread of activity preferences for international students compared to domestic students.
3.2 Research Question 2
In RQ2, we analysed if the proximity to campus affects one’s ability to participate in extracurricular activities.
- Null Hypothesis (\(H_{o}\)): Proximity to campus (campusDistance) does not affect participation in extracurricular activities.
- Alternative Hypothesis (\(H_{1}\)): Proximity to campus (campusDistance) has an effect on participation in extracurricular activities.
3.2.1 Campus Distance and Activity Count
Statistical Test: To evaluate this, we used the correlation analysis test between campus distance and the number of extracurricular activities using Pearson’s correlation test. Prior to conducting this test, we will verify the assumptions for the test first.
| Statistic | Campus Distance | Activity Count |
|---|---|---|
| Min | 0.000000 | 0.000000 |
| 1st Quartile | 1.000000 | 0.000000 |
| Median | 2.000000 | 1.000000 |
| Mean | 2.193548 | 1.451613 |
| 3rd Quartile | 3.000000 | 2.000000 |
| Max | 5.000000 | 4.000000 |
The descriptive statistics suggest that most students live fairly close to campus (within 2-3 units) and participate in 1-2 extracurricular activities. This variability in both campusDistance and activityCount supports further analysis to see if there’s a relationship between proximity and participation.
Moving on we inspect the relationship between the variables. As it can be seen from Figure 1, there seems to be no linear relation between the variables.
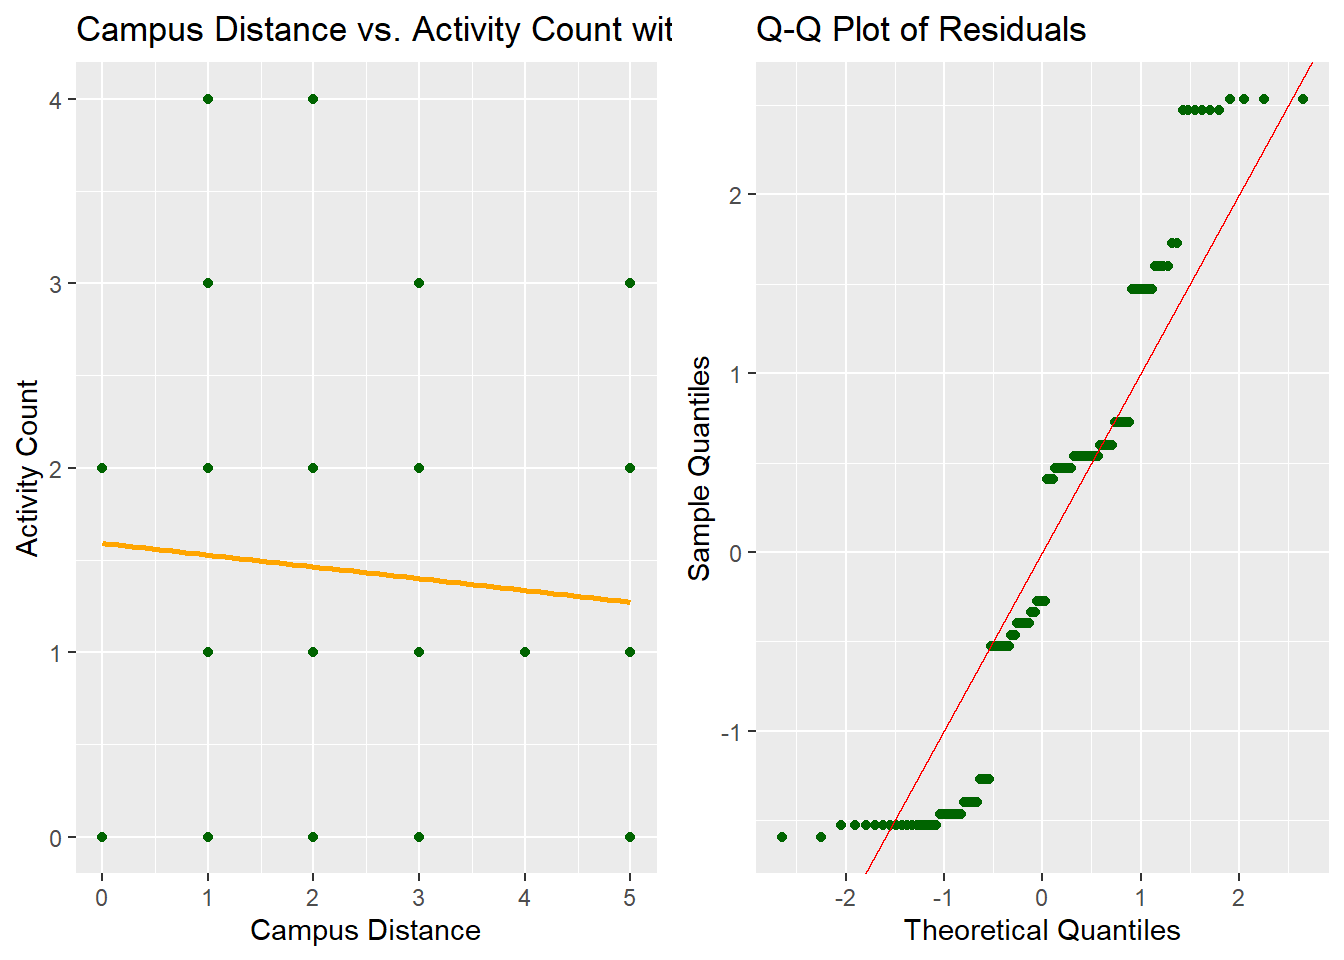
The Q-Q plot displays how the residuals (differences between observed and fitted values) align with the normal distribution. In this case, residuals do not fully align along the red diagonal line, indicating that normality is somewhat violated. The observed points deviate in a stepwise manner, particularly at the tails, which suggests potential non-normality in residuals.
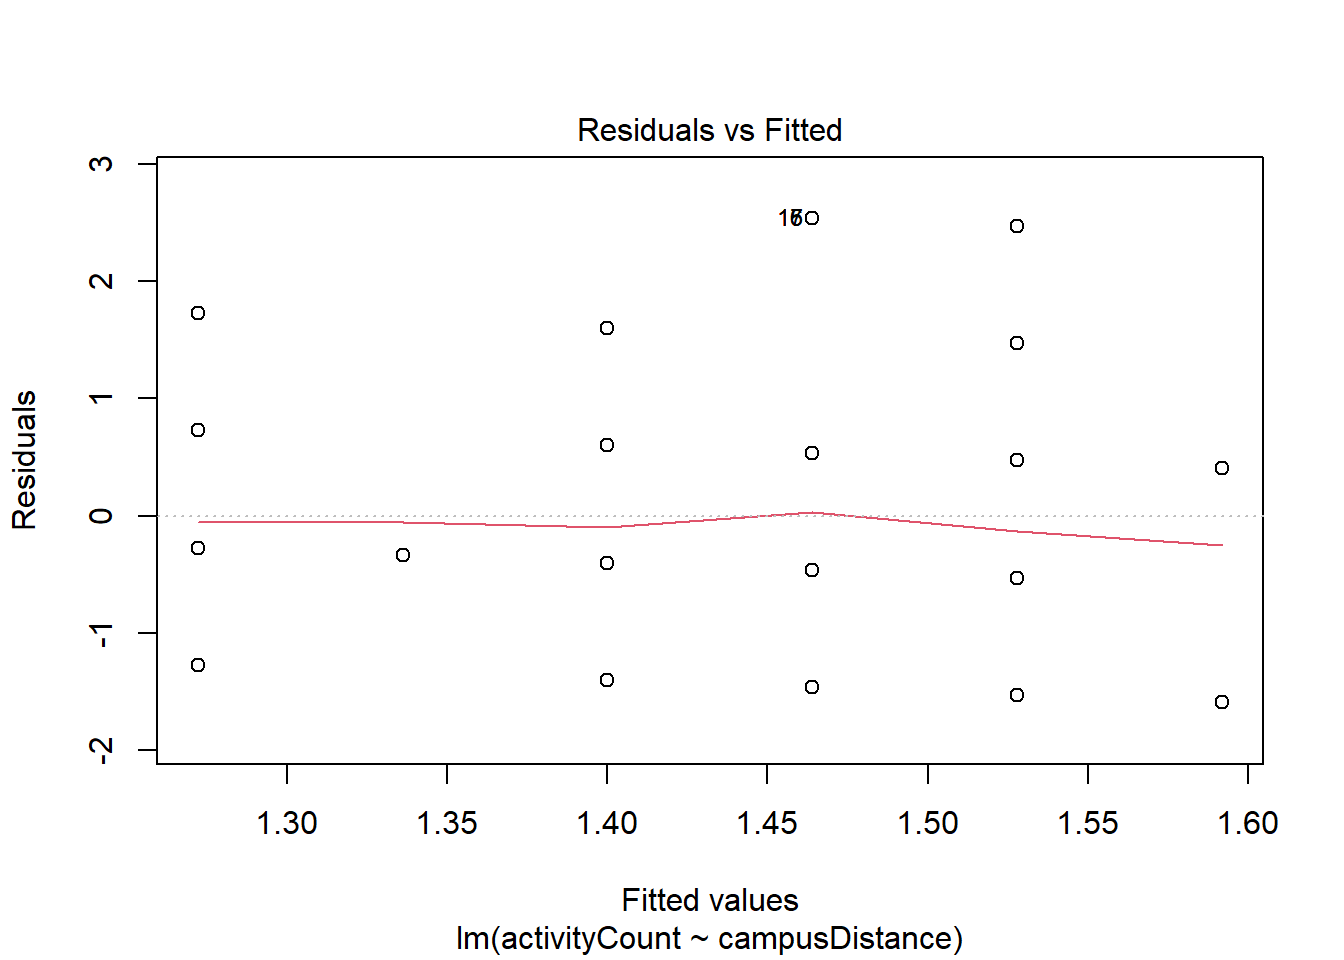
This plot helps in identifying any non-linearity, unequal variance (heteroscedasticity), or outliers. Here, residuals seem randomly scattered around the fitted line with no obvious pattern, suggesting homoscedasticity (constant variance). However, a few points like 33, 9, and 15 appear as potential outliers, which might influence the results.
Since there is non-normality between these variables, we proceed with Spearman’s rank correlation to analyze the association between campus distance and activity count.
| Test | Correlation Coefficient | p-Value | Significance |
|---|---|---|---|
| Pearson’s Correlation | -0.018 | 0.891 | Not Significant |
| Spearman’s Correlation | 0.025 | 0.847 | Not Significant |
The Spearman’s rank correlation test results are as follows:
- Spearman correlation coefficient: 0.025
- p-value: 0.847
This result indicates a very weak positive correlation between campusDistance and activityCount, but it is not statistically significant (p-value > 0.05). Therefore, we fail to reject the null hypothesis, suggesting no significant association between proximity to campus and participation in extracurricular activities based on this data.
3.3 Research Question 3
In RQ3, we analyzed if the the timing, the time spent on extra curricular activity affected one’s level of participation in extracurricular activities.
- Null Hypothesis (\(H_{o}\)): Time Commitment (timeCommitment) does not affect participation levels in extracurricular activities.
- Alternative Hypothesis (\(H_{1}\)): Time Commitment (timeCommitment) has an effect on participation levels in extracurricular activities.
We used the variables of student involvement (studentInvolvement) and activity count (activityCount) to represent the participation levels.
3.3.1 Time Commitment vs Student Involvement and Activity Count
Statistical Test: We used the correlation analysis test between time commitment and student involvement, and time commitment and activity count using Spearman’s correlation test. Before proceeding with the tests for each pair of variables, we will verify the assumptions for the test.
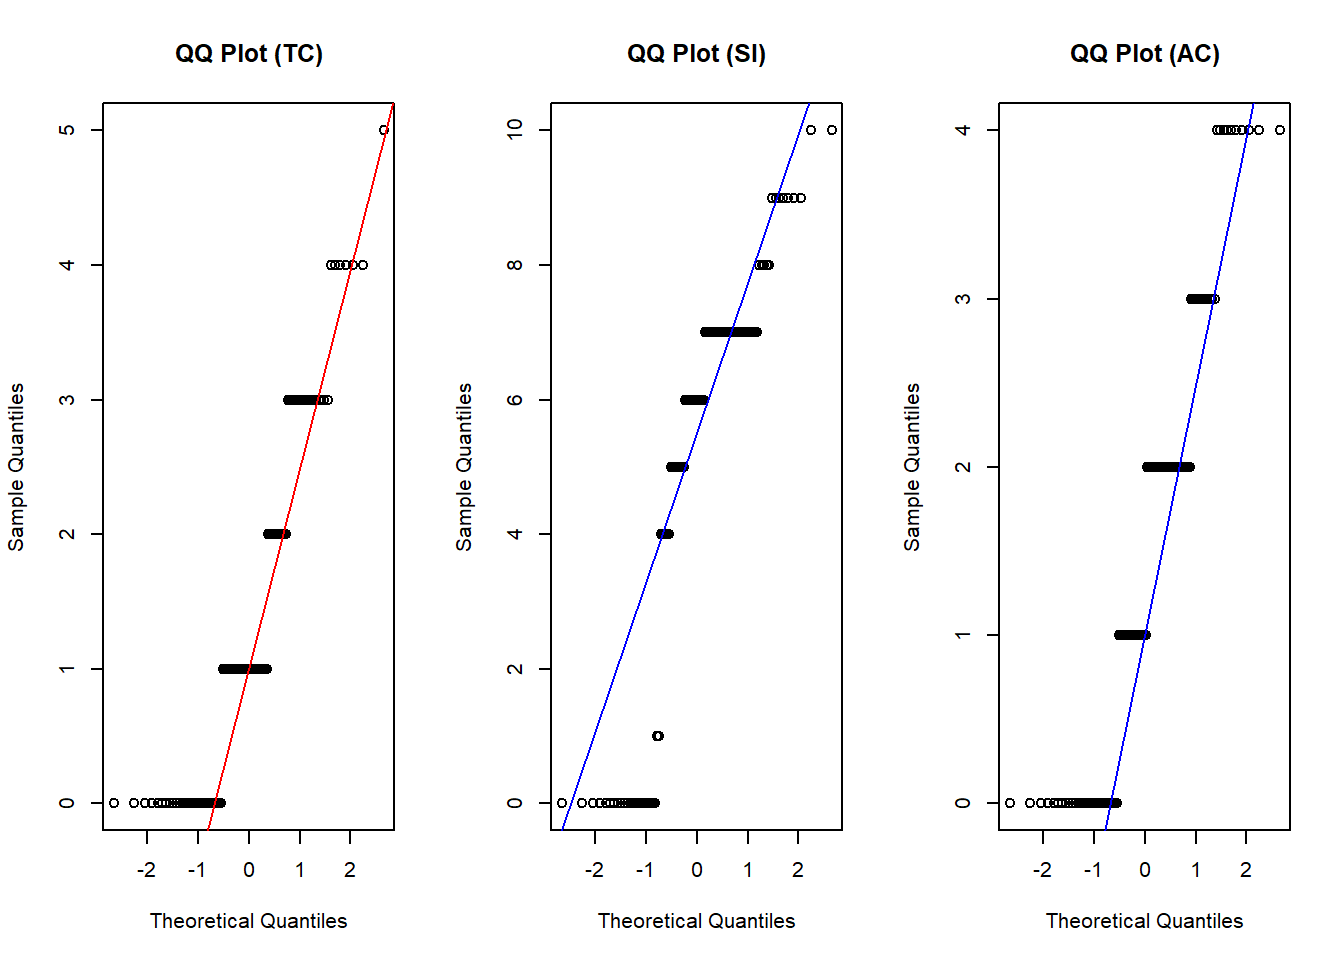
Normality of Variables: In our exploration we found that the variables of timeCommitment (TC), studentInvolvement (SI), and activityCount (AC) are not normally distributed as seen by the QQ plots in Figure 2 as they deviate from the normality line. Hence we proceeded to apply the correlation test using the Spearman’s rank coefficient instead of Pearson’s coefficient (requiring normality).
Monotonic Association: Next we confirmed the assumption of Spearman’s rank coefficient test requiring a monotonic relationship between the variables (timeCommitment and studentInvovlement) and (timeCommitment and activityCount). We found that the relationship between these variables was monotonic, specifically increasing as seen in Figure 3.
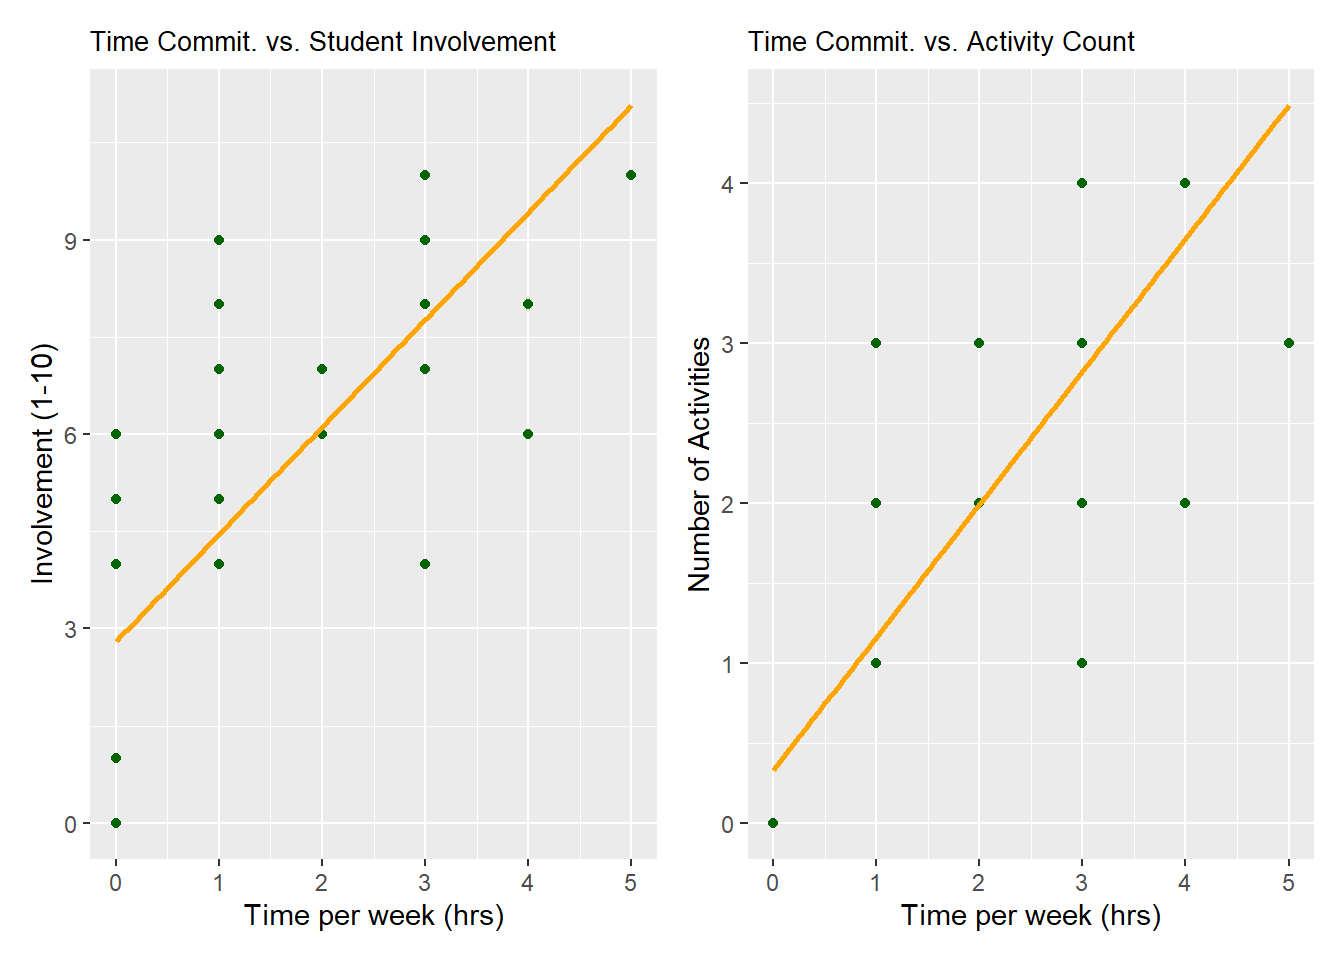
Results (Time Commitment and Student Involvement ): For timeCommitment and studentInvolvement we see that the Spearman’s rank correlation coefficient is 0.808, as seen in Table 2. This indicates a strong positive correlation, pointing to a significant monotonic relationship between timeCommitment and studentInvolvement. p-value is < 0.05, hence the correlation is statistically significant, and we can reject the null-hypothesis.
| Statistic | Value |
|---|---|
| Spearman Coefficient (rho) | 0.744 |
| p-value | 4.608e-23 |
Hence students who spend more time in the activities have higher participation in extra curricular activities measured by the activity count, as suggested by the strong association based on our data.
3.3.2 Time Commitment and Activity Count
We wanted to check whether the time commitment and participation measured by the activityCount variable were correlated. As discussed before, both the timeCommitment and activityCount variables met all assumptions for Spearman’s Rank Coefficient Test as per Figure 2 and Figure 3. We applied the test and found the following results.
| Statistic | Value |
|---|---|
| Spearman Coefficient (rho) | 0.886 |
| p-value | 1.227e-42 |
Results (Time Commitment and Activity Count): The results in Table 3 show that the coefficient value is 0.937, indicating a strong positive relationship. This would mean as time commitment increases, so does activity count. The p-value is < 0.05 and indicates strong evidence against the null hypothesis, hence the relationship is unlikely due to chance.
Hence, these results indicate a strong, statistically significant monotonic relationship between time commitment and activity count. As students increase their time commitment, so does their participation measured by involvement through the activity count variable.
4 Limitations
This study aimed to understand the reasons why students select and participate in ECAs at UTM. Although our results did not yield significant findings, several limitations may have contributed to this outcome:
One such notable limitation is the way in which our data was collected. Although we proposed StRS to collect our data, the study was carried out with SRS. StRS was not used due to the poor choice of strata, ones that were essentially homogeneous. In future studies, a better sampling methodology would have been to use StRS with a better choice of strata along with SRS or Systematic Sampling within the strata. A proposal for better choice of strata would be to use student status as that is much less likely to be homogeneous, rather than lecture section which is generally chosen by convenience to the student, rather than real differences within the population.
If the study were to be repeated, there would be a number of changes we would like to make in addition to modifying the sampling methodology. We would change the student major question from multiselect to a select one and instruct students to select the major they commit the most time to; this would allow us to streamline and simplify the analysis. The question regarding days of the week could likely be dropped as it proved to be nonbeneficial and was not used in the analysis. This question could be instead replaced with one regarding what time of day students spend most in ECAs. Finally, we would likely change the question regarding students living distance from campus to commute time. Since the study is interested in what factors affect ECA participation, considering commute time would be more likely to provide useful information, as two students living the same distance from campus could have vastly different commute times and thus have different amounts of time they can spend on ECAs.
5 Conclusion
This study aimed to investigate the reasons that students select certain extracurricular activities at the University of Toronto Mississauga campus (UTM). Analysis on the preferred types of extracurricular activities whilst also examining whether demographic factors influence these preferences showed that although the most popular type of ECAs among students was Athletics and Sports, demographic factors such as gender, student status and program of study have no significant effect on the preference for certain ECAs. Regarding the proximity to campus and one’s ability to participate in ECAs, analysis indicated a very weak positive relationship between the distance from campus and the number of activities that students engage in. Unfortunately, this relationship is not statistically significant. Finally, analysis on the time spent on ECAs indicates that there is a strong statistically significant relationship between time commitment and activity count. Notably, in the future, it would be more beneficial to consider time commuting as a variable of interest than distance from campus. Additionally, modifying the sampling methodology would be an important change if this study were to be repeated by other researchers. Choosing a sampling methodology such as StRS with strata that are have true differences between them would allow for the benefits that come from StRS including a reduced variance, which would strengthen the results.