| Min | Max | Mean | Median | SD | IQR | |
|---|---|---|---|---|---|---|
| Value | 67 | 100 | 93.4867 | 96 | 6.9618 | 6.75 |
Impact of Caffeinated and Caffeine-Free Beverages on the Problem Solving Skills of A Virtual Population
Study for STA305 at University of Toronto Mississauga
Abstract
Caffeine is the most popular psychoactive substance in the world, particularly due to its widely known stimulating effects. Due to its properties as a stimulant, it is commonly used to temporarily enhance mental alertness. Intrigued by caffeine’s effects on mental alertness, this study aims to analyze whether an association exists between the use of caffeine by individuals on their problem solving ability. To explore this potential relationship, we provided coffee, energy drinks, and their caffeine-free versions to participants from a virtual population. Once the participants drank their assigned drink, they underwent a problem solving test to assess their problem solving ability. The results showed that there is no significant difference in the mean scores of the participants across the different drinks that were administered to them. This implies that while caffeine may enhance mental alertness, it does not appear to have any significant effect on the problem solving ability of the participants. Future research should explore these relationships using larger sample sizes, real-world participants, alternative problem solving assessments, and by controlling the time between the administration of the drinks and the test to better understand caffeine’s potential impact on problem-solving skills.
1 Introduction
1.1 Background
As the world’s most popular psychoactive substance, caffeine’s widely known effects have been studied extensively. Due to it being a stimulant, caffeine has most commonly been used to temporarily increase mental alertness which improves things like memory, while lessening fatigue, thus providing an energy boost. However, some people may experience certain drawbacks like digestion or anxiety issues.
In this study, we are analyzing whether there is an association between caffeine use and problem solving skills by providing coffee, energy drinks, and their caffeine-free counterparts to participants from The Islands, a virtual population developed by the University of Queensland for learning and teaching in statistics. Our sample was split into three age groups: 18-35, 36-54, and 55+. Considering the effects of caffeine, participants assigned a caffeinated drink would be expected to achieve a higher score than those that are not.
1.2 Research Questions
We aim to study the following research questions:
Research Question 1 (RQ1): Does beverage type have an impact on problem solving score?
\(H_{0}\): no association between beverage type and problem solving score.
\(H_{a}\): association between beverage type and problem solving score exists.
Research Question 2 (RQ2): Do caffeinated coffee and energy drinks have a higher impact on problem solving scores compared to their caffeine-free counterparts?
\(H_{0}\): no association between caffeinated drinks and higher score
\(H_{a}\): association between caffeinated drinks and higher score exists.
The sections that follow detail our study’s methodology, present the analysis and results, address limitations, and conclude with key takeaways and future considerations.
2 Methodology
2.1 Design and Setup
In February 2025, we conducted an experiment to determine whether different caffeinated and caffeine-free drinks affect the problem solving skills of virtual participants on The Islands. In our experiment we initially had a balanced two factor design with drink type as the main factor and age as a blocking factor. Participants were blocked within one of three age groups, where they were provided one of five drinks (the treatment) and had their score on a 20 minute problem solving test (the response) recorded. Each of the three age group blocks contained an equal number of participants for each treatment, per our RCB design.
However, due to violations of assumptions, we could not incorporate our blocking factor of age in our design (further details in Section 3.2). All data was collected using participants from the town of Nidoma in the virtual population to control for environmental factors as much as possible. To further account for nuisance factors, treatments were randomly assigned among participants using an R script (See Listing 1 in Appendix).
The experiment included a total of 150 participants \((n = 150)\), with 50 in each of the following age blocks: 18-35, 36-54, and 55+. Each participant was given one of five 250 millilitre drinks \((a = 5)\): Water (Control), Energy Drink, Energy Drink Decaffeinated, Coffee, or Coffee Decaffeinated. Each treatment factor contained 30 participants \((n_j = 30)\), split evenly among the three age blocks thus giving a balanced design. This also provided for enough repetitions to further account for nuisance factors that may not have been dealt with through the blocking or randomization. Since each participant was exposed to only one treatment and randomly assigned to a treatment group, this experiment utilized a between-subjects design.
2.2 Data Collection
Each participant was provided their randomly assigned drink and then administered a 20 minute problem solving test. The test was scored from 0 to 100 and after completion, each participant’s score was recorded. Once all data collection was completed, it was cleaned, stripped of any personally identifying information and assigned factor levels and names which were more easily utilizable and readable within R.
3 Analysis
3.1 Summary Statistics and Checking Assumptions
We began by gathering summary statistics of our data, presented in Table 1. The high mean and median indicate that participants generally scored well on the problem solving test. A low standard deviation indicates tight clustering around the mean and a low IQR indicates tight clustering around the median. The minimum of 67 lies well outside of 1.5 \(\times\) IQR, indicating a presence of outliers on the low side, with further inspection necessary to determine the amount. Since the data is skewed toward higher values and capped at 100, there are no outliers on the upper end.
More preliminary information is obtained plotting the treatments in relation to scores in Figure 1.
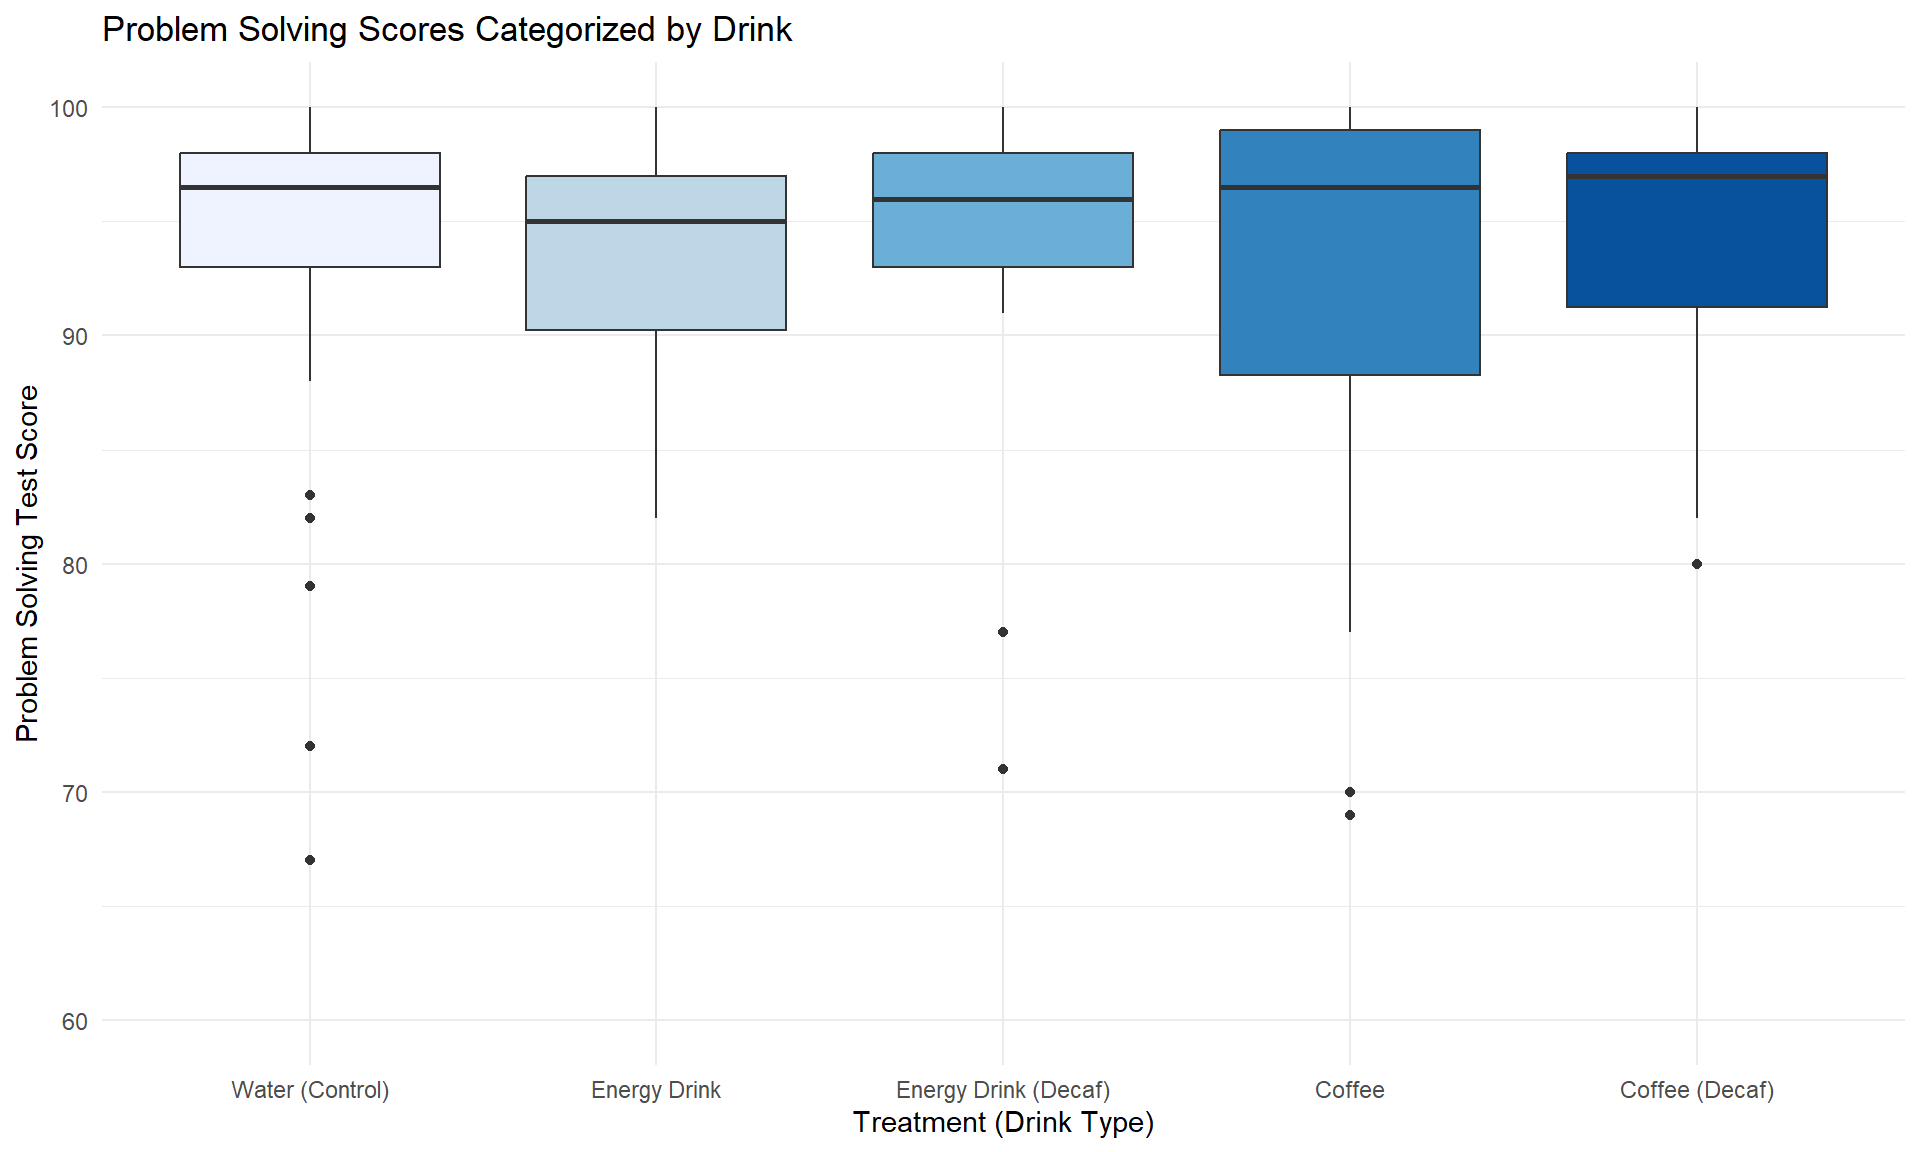
From the boxplot, we can make an initial inference that the means are likely similar among groups, however the variances are different. To confirm this, further analysis will be utilized, but prior to that we must check assumptions to determine if a one-way ANOVA can be utilized, or if we must proceed with a Kruskal-Wallis non-parametric test. The three assumptions that must be checked are independence, normal distribution, and homogeneity of variance.
- Independence: This assumption is satisfied by design. All data points are collected from unique individuals whose results do not depend on the others.
- Normality: Violated, as seen in Figure 2
- Homogeneity of Variance: Violated, as seen in Figure 2
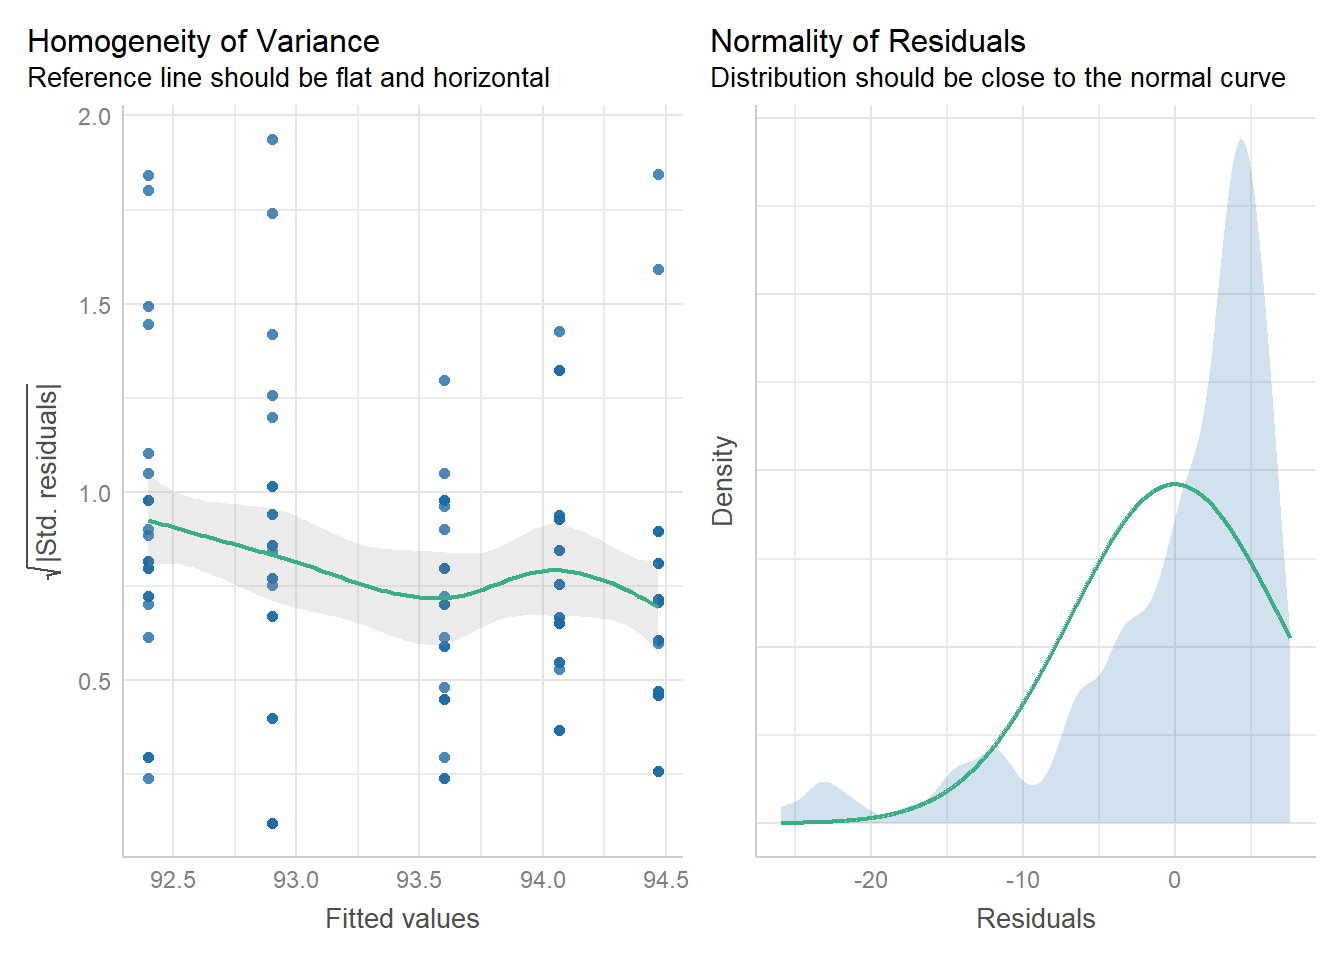
3.2 Statistical Tests
As the assumption of normality and homogeneity of variance have been violated, we are unable to use a one-way ANOVA test. Instead, we opt to use Kruskal-Wallis non-parametric H-test utilizing the treatment type (beverage provided) as our factor. The results of the Kruskal-Wallis H-test are displayed below in Table 2.
| H-Statistic | P Value | DF |
|---|---|---|
| 1.811637 | 0.7703527 | 4 |
4 Results
From Table 2 we find a p-value for the Kruskal-Wallis H-test is 0.7704. Since this p-value is much greater than our significance level of 0.05, we do not have sufficient evidence to suggest a difference in mean problem-solving scores among the treatment groups. Therefore, we find that beverage type does not affect problem-solving scores. This result is to be expected as aligns with our inferences from Figure 1.
Since there were no significant results, no further follow-up was necessary for RQ2. If there were statistically significant differences in caffeinated vs non-caffeinated beverages, we would have also seen statistically significant evidence that the means among drinks were not equal. Consequently, caffeinated coffee and energy drinks do not have a greater impact on problem-solving scores than their caffeine-free counterparts.
5 Limitations
This study had a number of limitations. For starters, the study could have been improved by implementing a delay between beverage consumption and the problem-solving test to better observe its effects. We administered the test immediately after giving participants their treatment, which could have impacted results. Allowing more time for caffeine absorption before testing could have provided a clearer understanding of its effects on problem-solving performance.
Additionally, despite the depth provided by The Islands for conducting an experiment, using a virtual population is a major limitation in assessing the impact of caffeine on the problem solving skills of real people. This is because it does not take all of the countless real life factors that impact the effects of caffeine on the body into account. Furthermore, we do not know how the problem solving quiz is implemented, resulting in some uncertainty about the relevance of its assessment to our study. As a result, our experiment may not be incredibly relevant to the real world. Further studies should consider using a real world population instead.
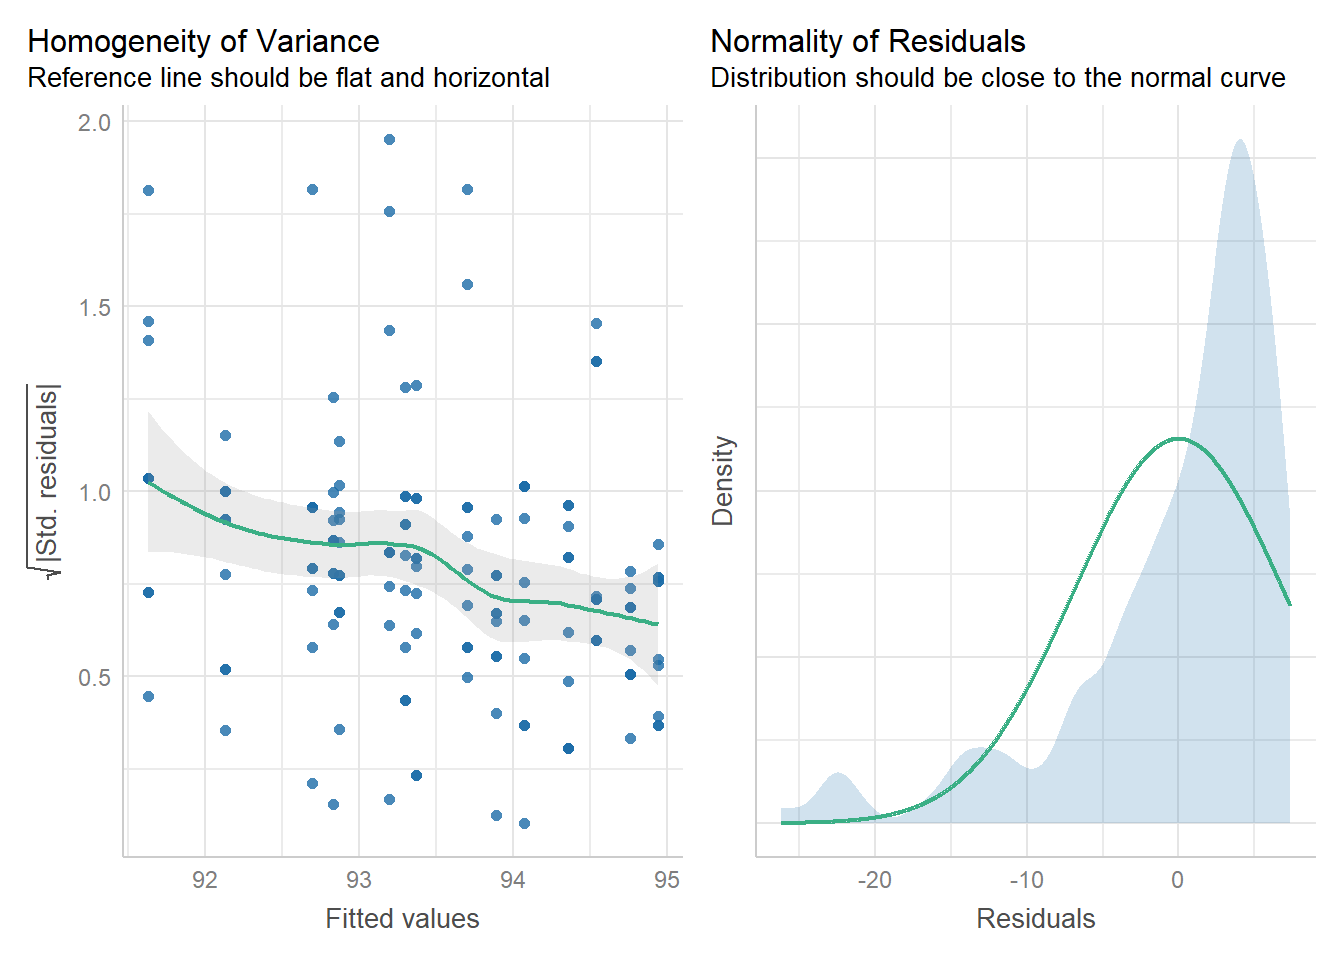
The final major limitation we had was the model used. We would have liked to utilize a two-way ANOVA model, with drink type and age as factors, as Figure 3 indicates there might be some difference among different drinks between age groups.

Unfortunately, similar to the one-way ANOVA, our assumptions for both normality and homogeneity of variance were violated, shown in Figure 4. Due to the challenge of implementing a non-parametric two-way ANOVA test and because of time constraints, we were unfortunately unable to implement this model and instead had to utilize the one-way Kruskal-Wallis model. Further studies should consider using a larger sample size as it may help approximate a normal distribution, thereby allowing us to satisfy the assumptions required to use the two-way ANOVA test with age and drinks as factors.
6 Conclusion
By analyzing problem-solving scores of the virtual participants across the different treatments, we found no evidence of a statistical difference in means across the treatments. Since no statistical difference was observed in the means across the treatments in the global test, it follows that there is also no significant difference in the means between caffeinated and non-caffeinated drinks.
To extend this study, researchers may examine the effects of stimulants other than caffeine on the problem solving skills of individuals. Future studies may also consider blocking for additional factors like gender to better capture potential differences in stimulant effectiveness across subgroups. Furthermore, researchers could expand the scope of the study by testing the effects of stimulants on other physical or mental abilities, beyond just problem solving skills.
Long-term studies involving repeated measurements over-time can also be done to better understand how prolonged usage of selected stimulants may impact the problem solving skills of participants. Researchers may also experiment with different dosage levels or different time intervals between administering the stimulants and administering the problem solving assessment. This may allow treatment effects to be more accurately reflected in the scores of participants.
7 Appendix
*Note: All content is the same as submitted for final draft in class, except for the appendix which has been changed for better readability on my website.
library(clipr)
groups <- c("Water", "Coffee", "Coffee (Decaf)", "Energy Drink",
          "Energy Drink (Decaf)")
labels <- rep(groups, 10)
shuffled <- sample(labels)
write_clip(shuffled, type = "text")packages <- c("tidyverse", "patchwork", "performance", "knitr", "see",
"kableExtra", "broom")
for(pkg in packages) {
if (!requireNamespace(pkg, quietly = TRUE)) {
install.packages(pkg)
}
}
library(tidyverse)
library(patchwork)
library(performance)
library(knitr)
library(see)
library(kableExtra)
library(broom)data <- read.csv("cleaned_data.csv", header = TRUE)
data$age_group <- factor(data$age_group,
levels = c("Y", "M", "O"),
labels = c("18-35", "36-54", "55+"))
data$treatment <- factor(data$treatment,
levels = c("W", "E", "ED", "C", "CD"),
labels = c("Water (Control)", "Energy Drink",
"Energy Drink (Decaf)", "Coffee",
"Coffee (Decaf)"))
attach(data)sum_data <- data.frame(Value = c(min(score), max(score), round(mean(score), 4),
median(score), round(sd(score), 4), IQR(score)))
labs <- c("Min", "Max", "Mean", "Median", "SD", "IQR")
kable(t(sum_data), col.names = labs, align = "c")ggplot(data, aes(x = treatment, y = score, fill = treatment)) +
geom_boxplot() +
scale_y_continuous(limits = c(60, 100)) +
scale_fill_brewer(palette = "Blues") +
labs(title = "Problem Solving Scores Categorized by Drink",
x = "Treatment (Drink Type)", y = "Problem Solving Test Score") +
theme(legend.position = "none")one_factor_model <- aov(score ~ treatment, data = data)
check_model(one_factor_model, check = c("normality", "homogeneity")) non_par <- kruskal.test(score~treatment, data)
formatted <- as.data.frame(tidy(non_par))
formatted$method <- NULL
col_names <- c("H-Statistic", "P Value", "DF")
kable(formatted, col.names = col_names,
caption = "Kruskal-Wallis H-Test")age <- c("18-35", "36-54", "55+")
ggplot(data, aes(x = treatment, y = score, fill = age_group)) +
geom_boxplot(position = position_dodge(width = 0.8)) +
scale_y_continuous(limits = c(60, 100)) +
labs(title = "Problem Solving Scores by Drink and Age Group",
x = "Treatment (Drink Type)", y = "Problem Solving Test Scores",
fill = "Age Group") +
scale_fill_brewer(palette = "Blues", breaks = age, labels = age) +
theme_minimal()two_factor_model <- aov(score ~ treatment + age_group, data = data)
check_model(two_factor_model, check = c("normality", "homogeneity"))